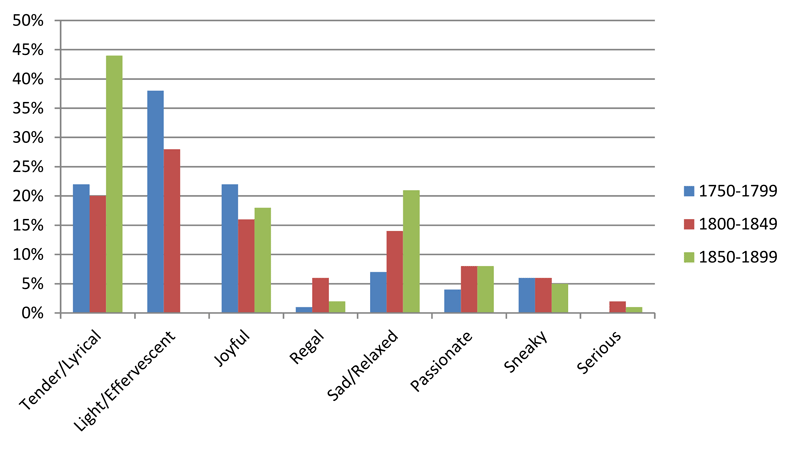
Example 9.
Bar Graph of Proportion of Each Cluster in Each Epoch