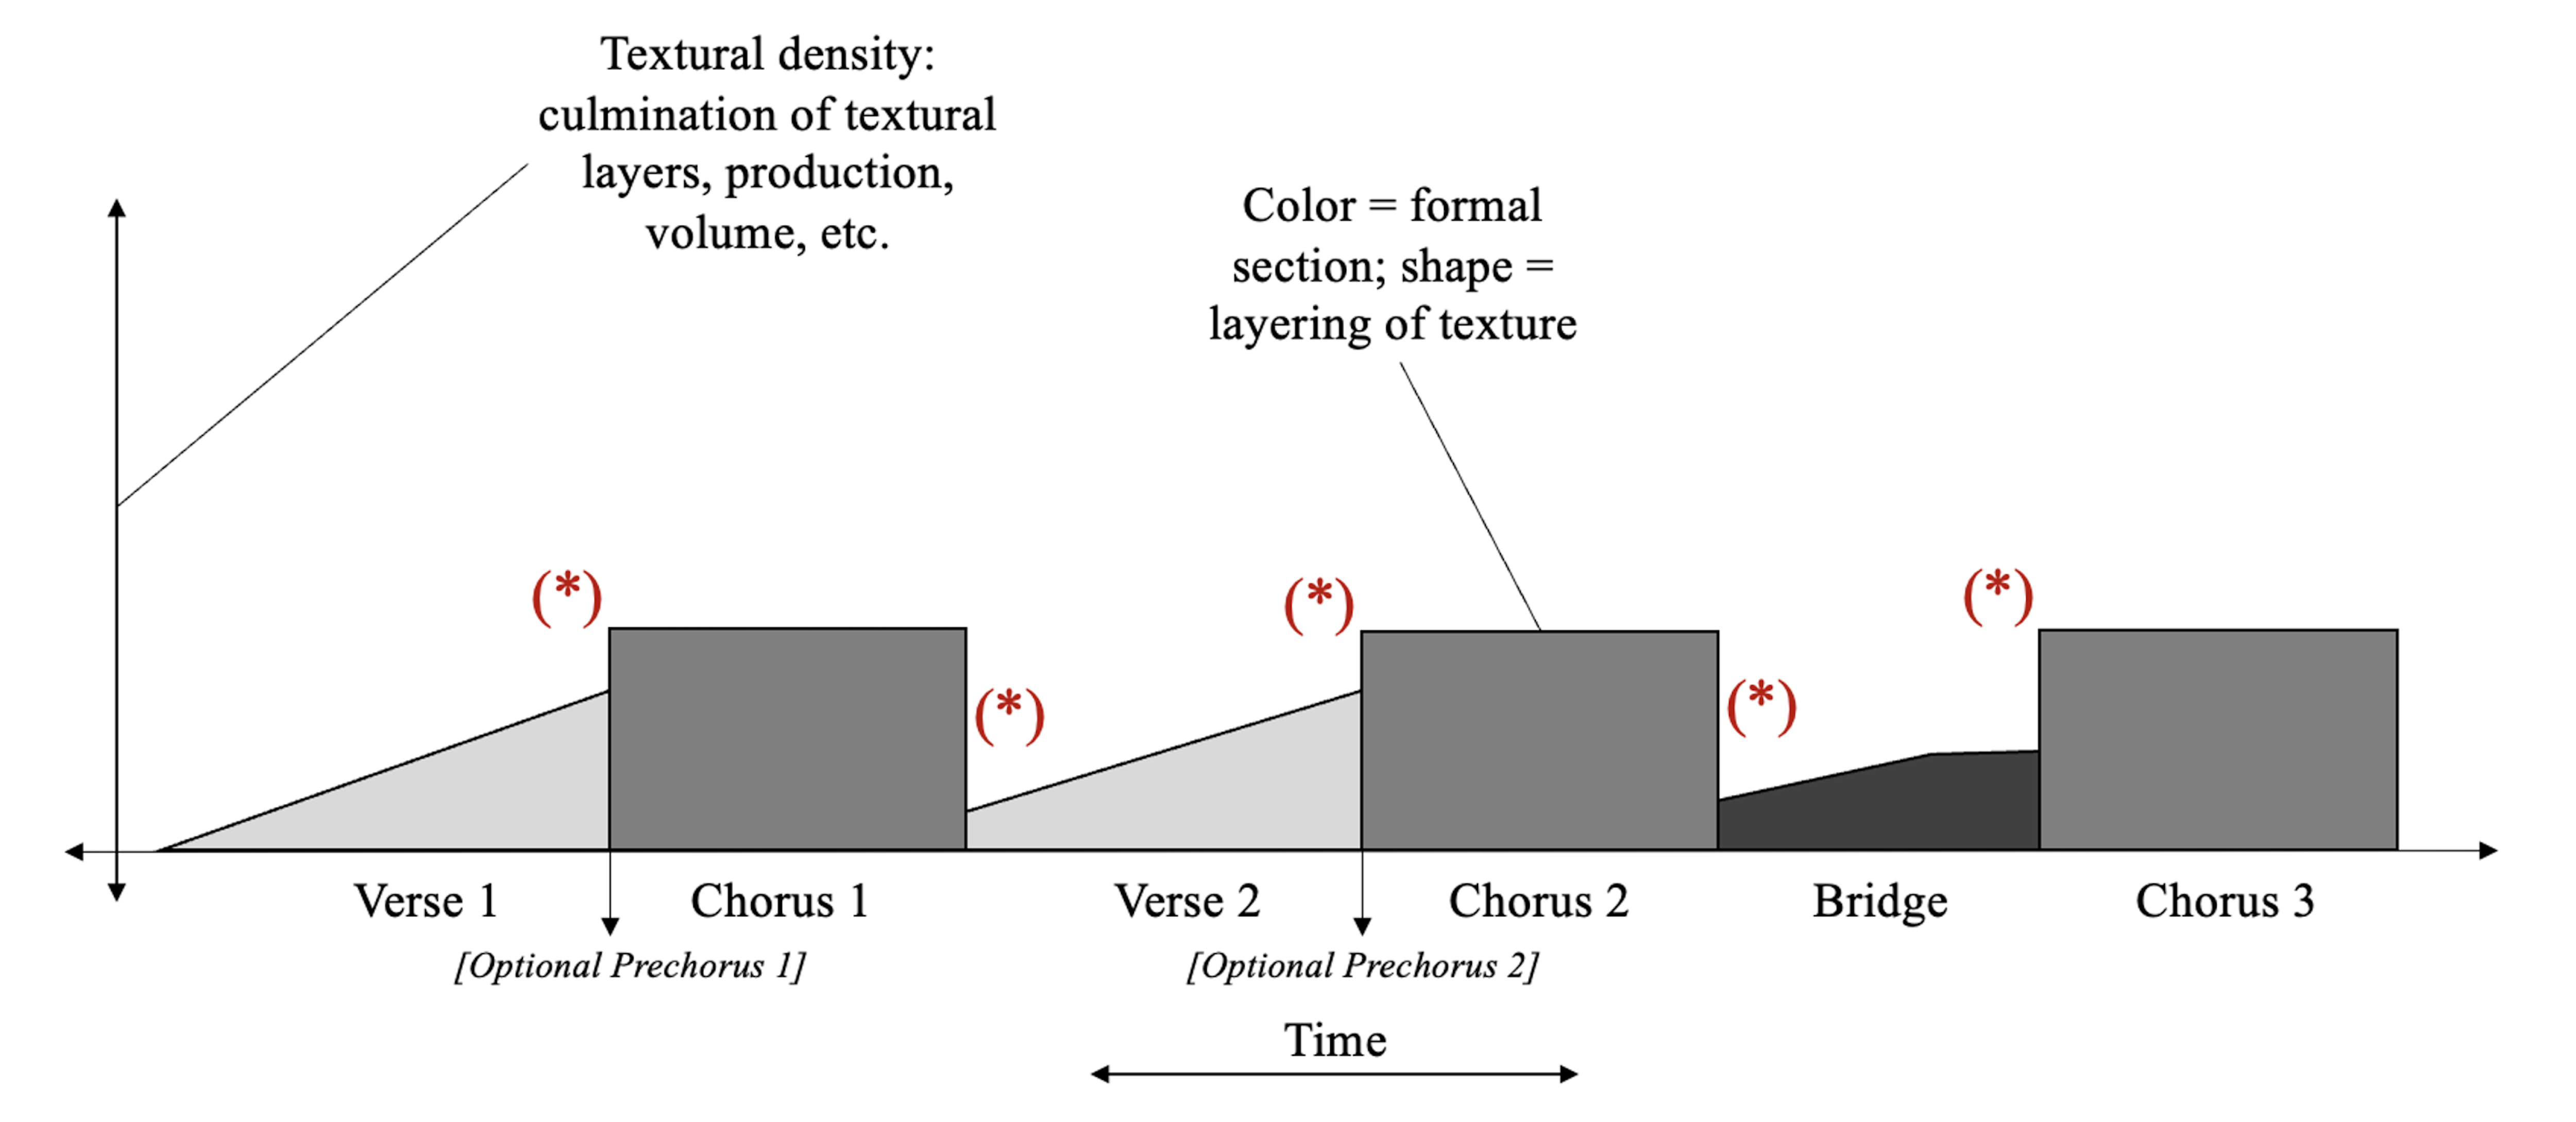
Example 16. An outline of the texture model with labels, where the x-axis shows a song’s clock time, the y-axis shows textural density, color indicates formal section (coinciding with the labels underneath), shape indicates broadly the fluctuations of texture, and red stars indicate the most viable locations for textural cues to occur. I refer to this figure as “The Prototype.”