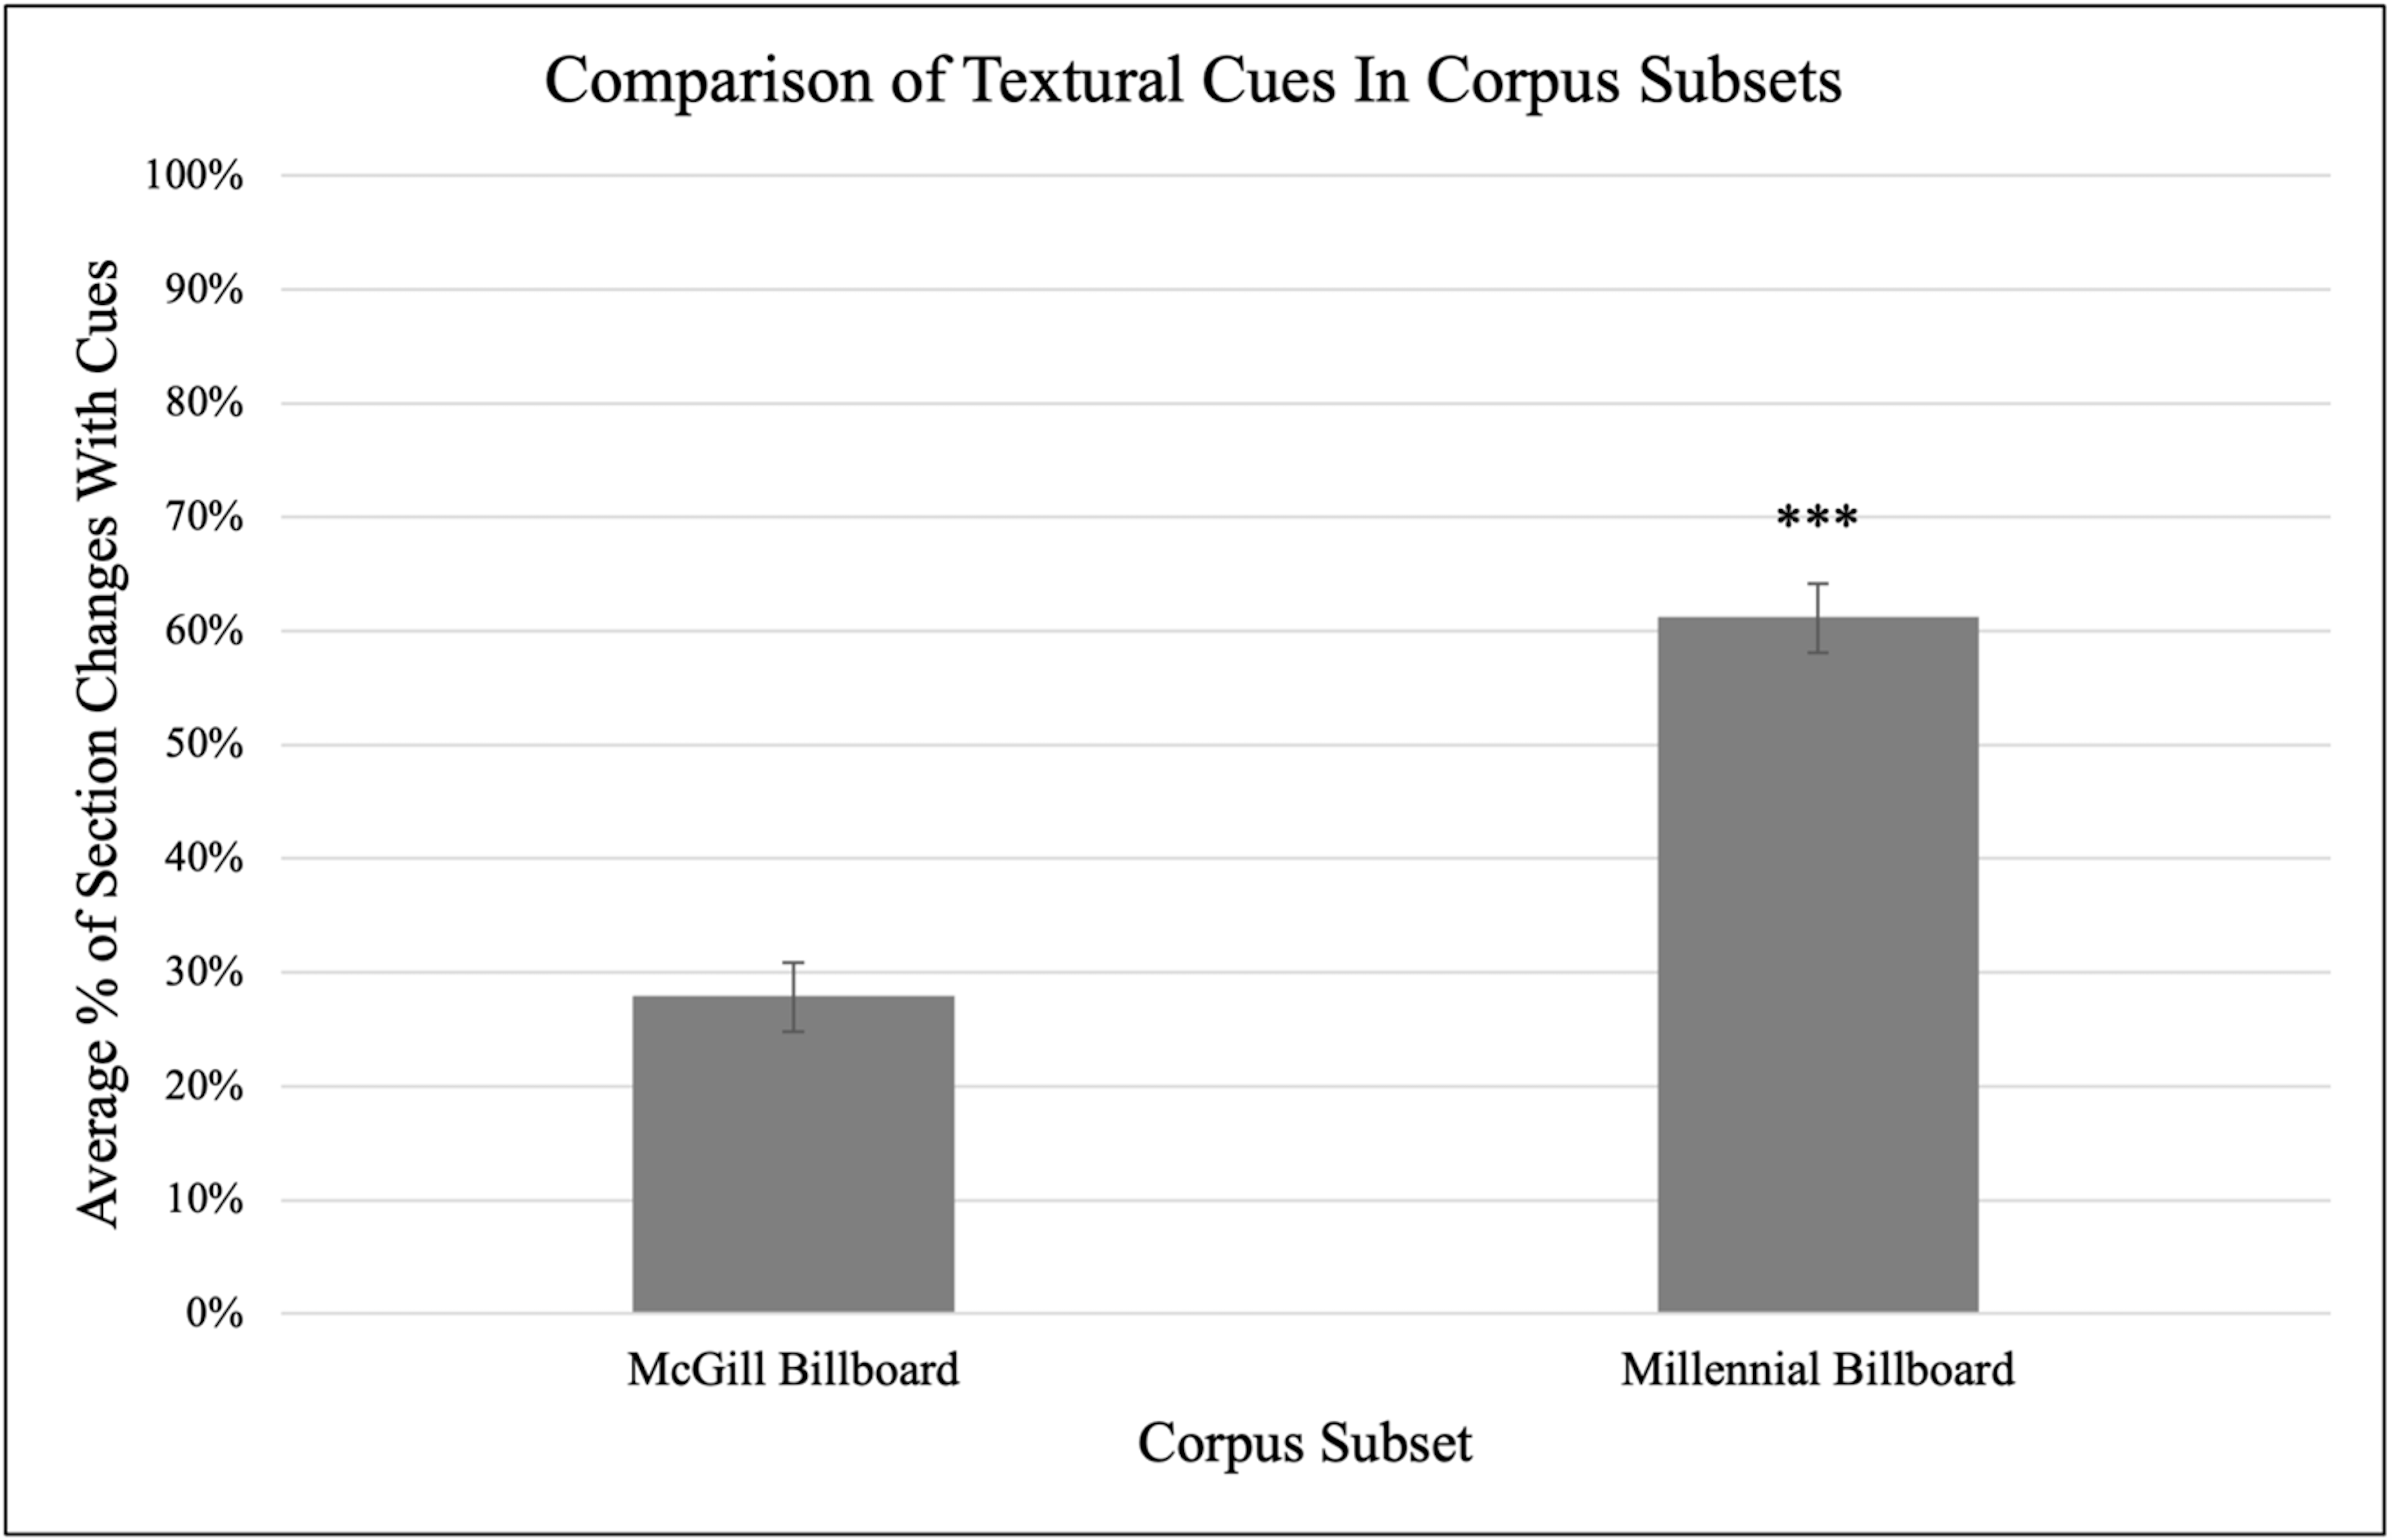
Example 4. A comparison of the McGill Billboard dataset sample with the Millennial Billboard dataset sample in the Extended corpus, showing the average percent of songs’ section changes with textural cues. Asterisks indicate statistical significance, while error bars indicate standard deviation: here, the number of cues encoded in the Millennial subset is statistically different from the number of cues in the McGill subset, and error bars show the range of encoded cues in relation to the mean.