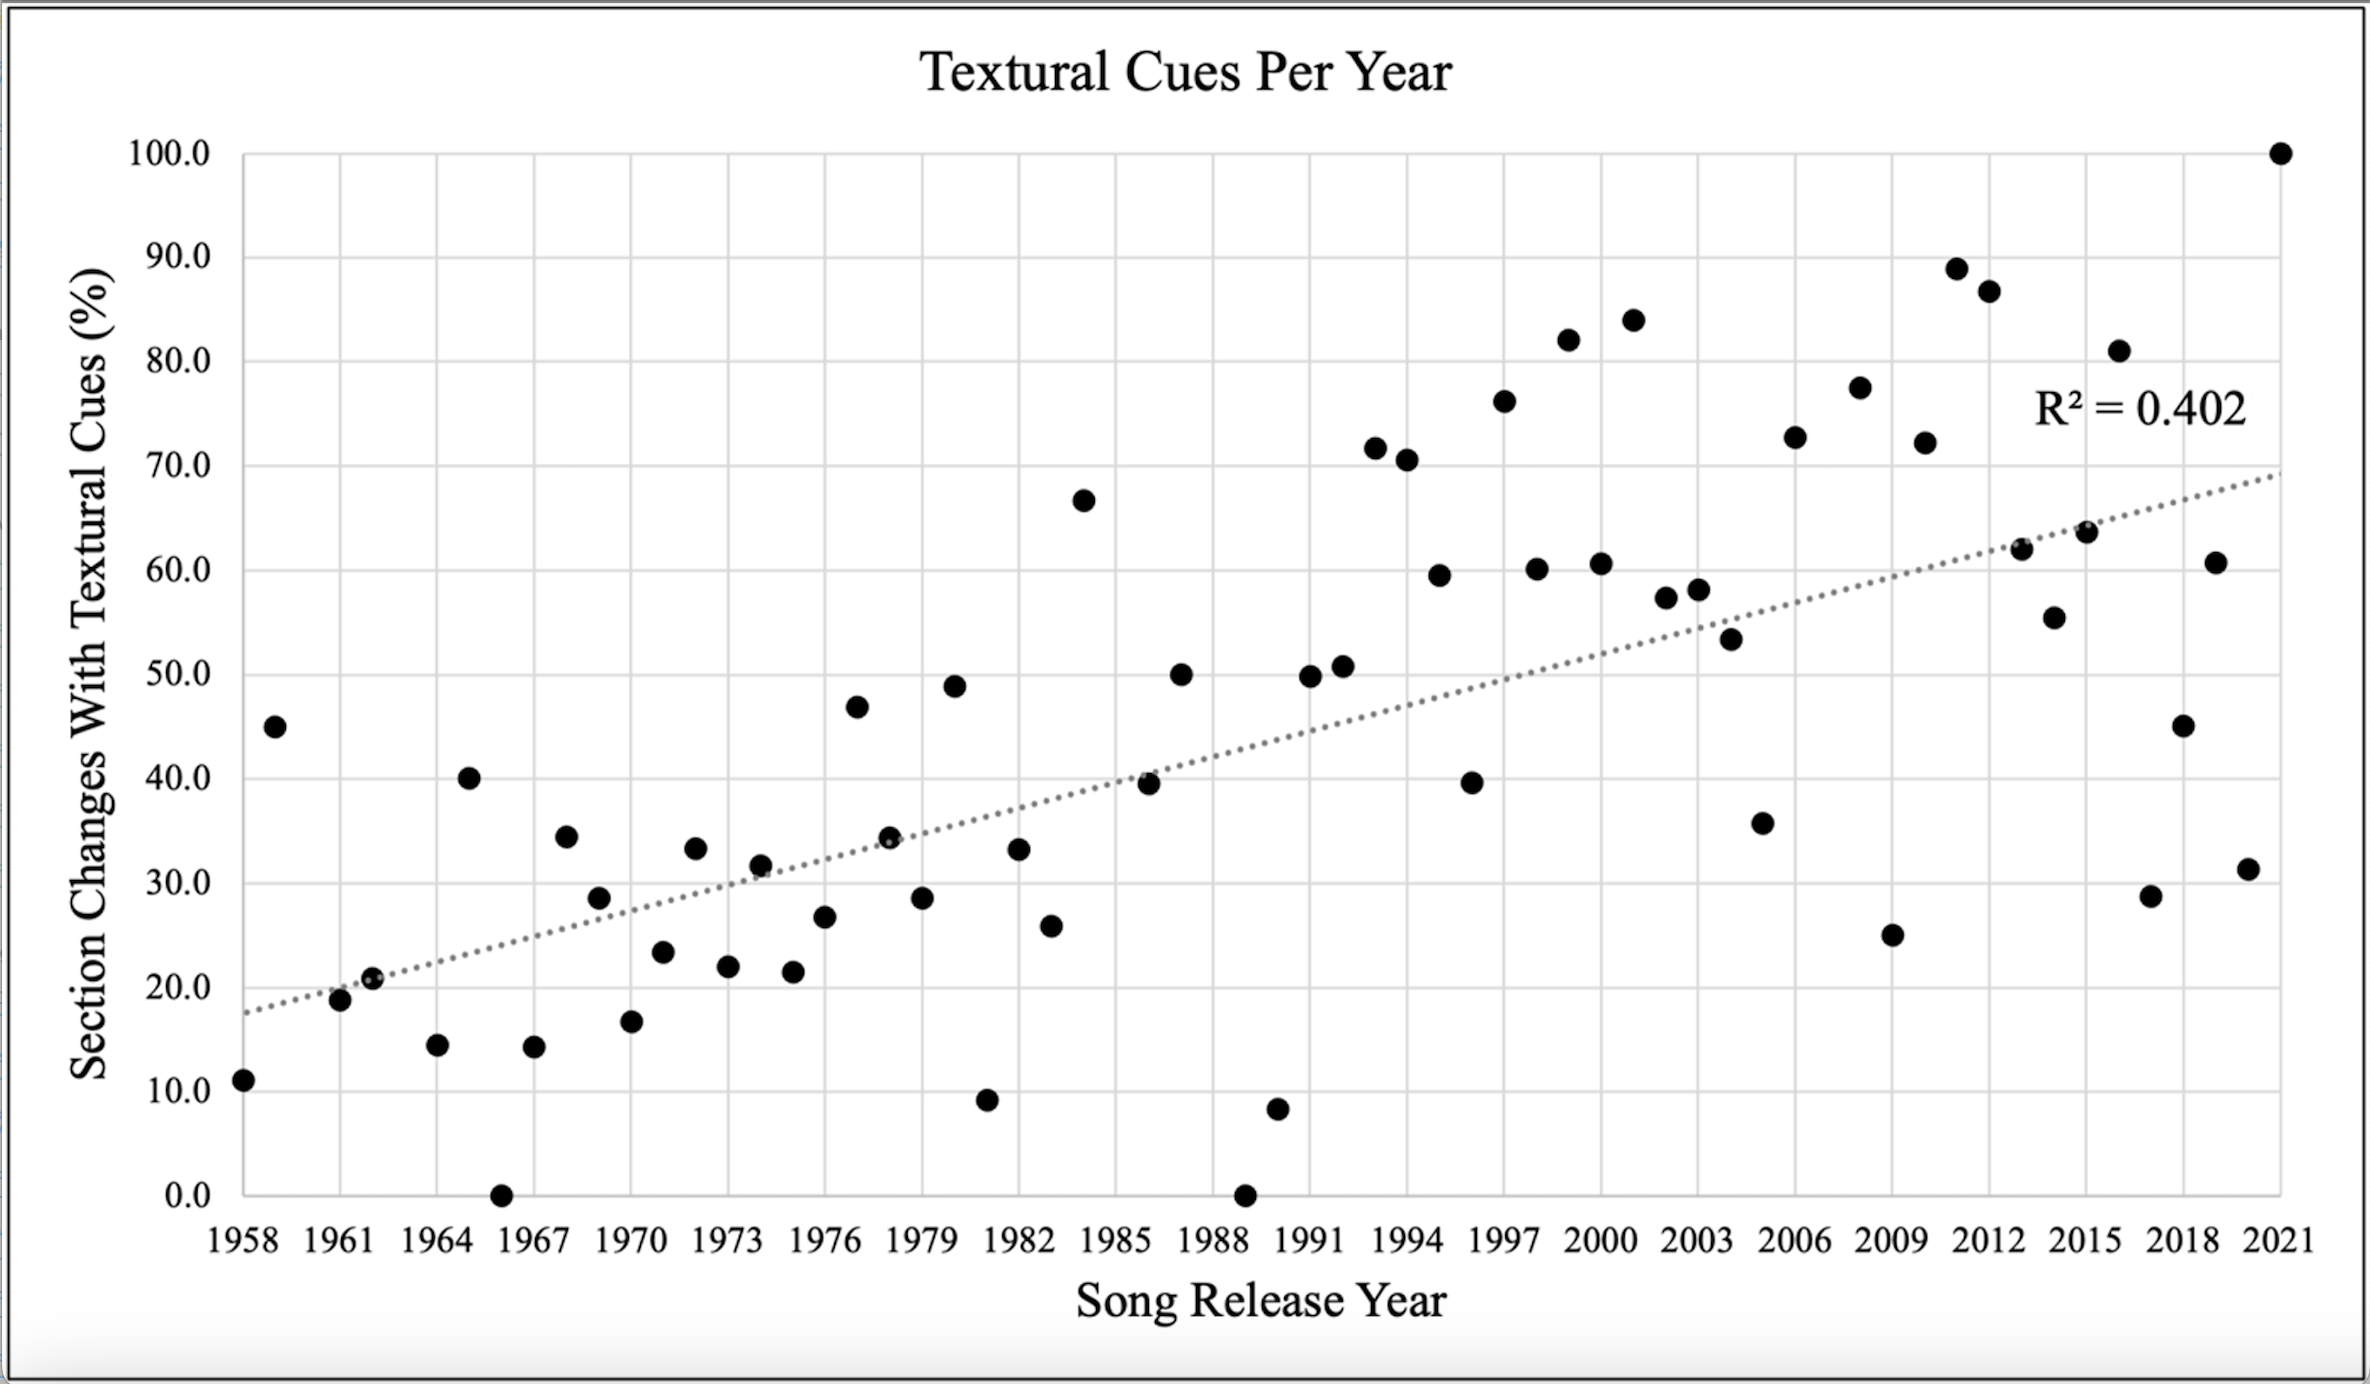
Example 5. Percentage of textural cues found at section changes for each song (y-axis) across 63 years of Billboard Hot 100 hits (x-axis). R2 = .402; F(1, 59) = 39.67, p < .0001.