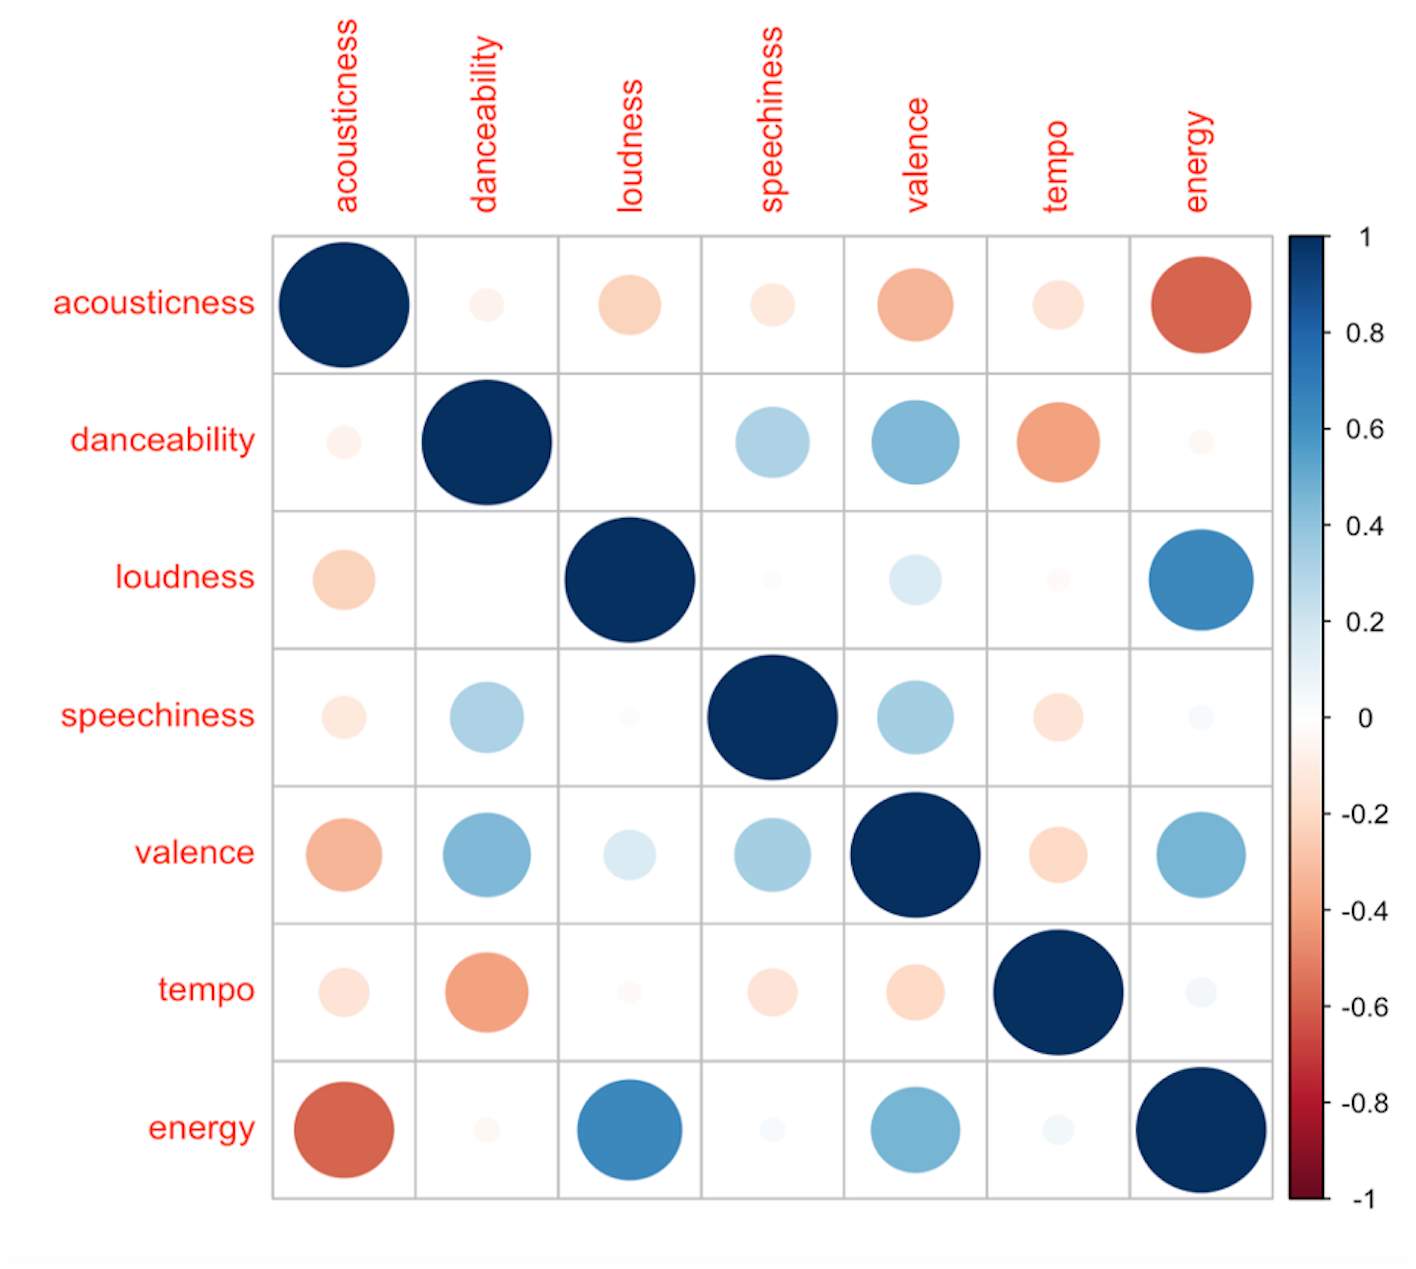
Example 7. Correlation plot for the Millennial subset. Larger and darker circles show greater correlation between attributes, with red denoting a negative correlation and blue denoting a positive correlation. Note that the correlations between tempo and energy, as well as energy and speechiness are correlated in the original McGill Billboard dataset, but not in the Millennial dataset. Similarly, speechiness and danceability, as well as valence and speechiness are correlated in the Millennial corpus but not in the McGill corpus.