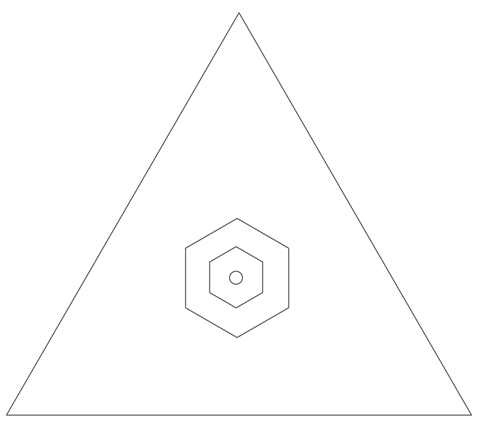
Example 6. The superswing hexagon embedded within onset space. The open circle in the middle of the figure again represents isochrony. The green line shows the length of the first duration, the blue line shows the middle duration, and the red line shows the last duration, with shared numbers in each edge ratio highlighted. The white circle in the center of the triangle indicates isochrony.