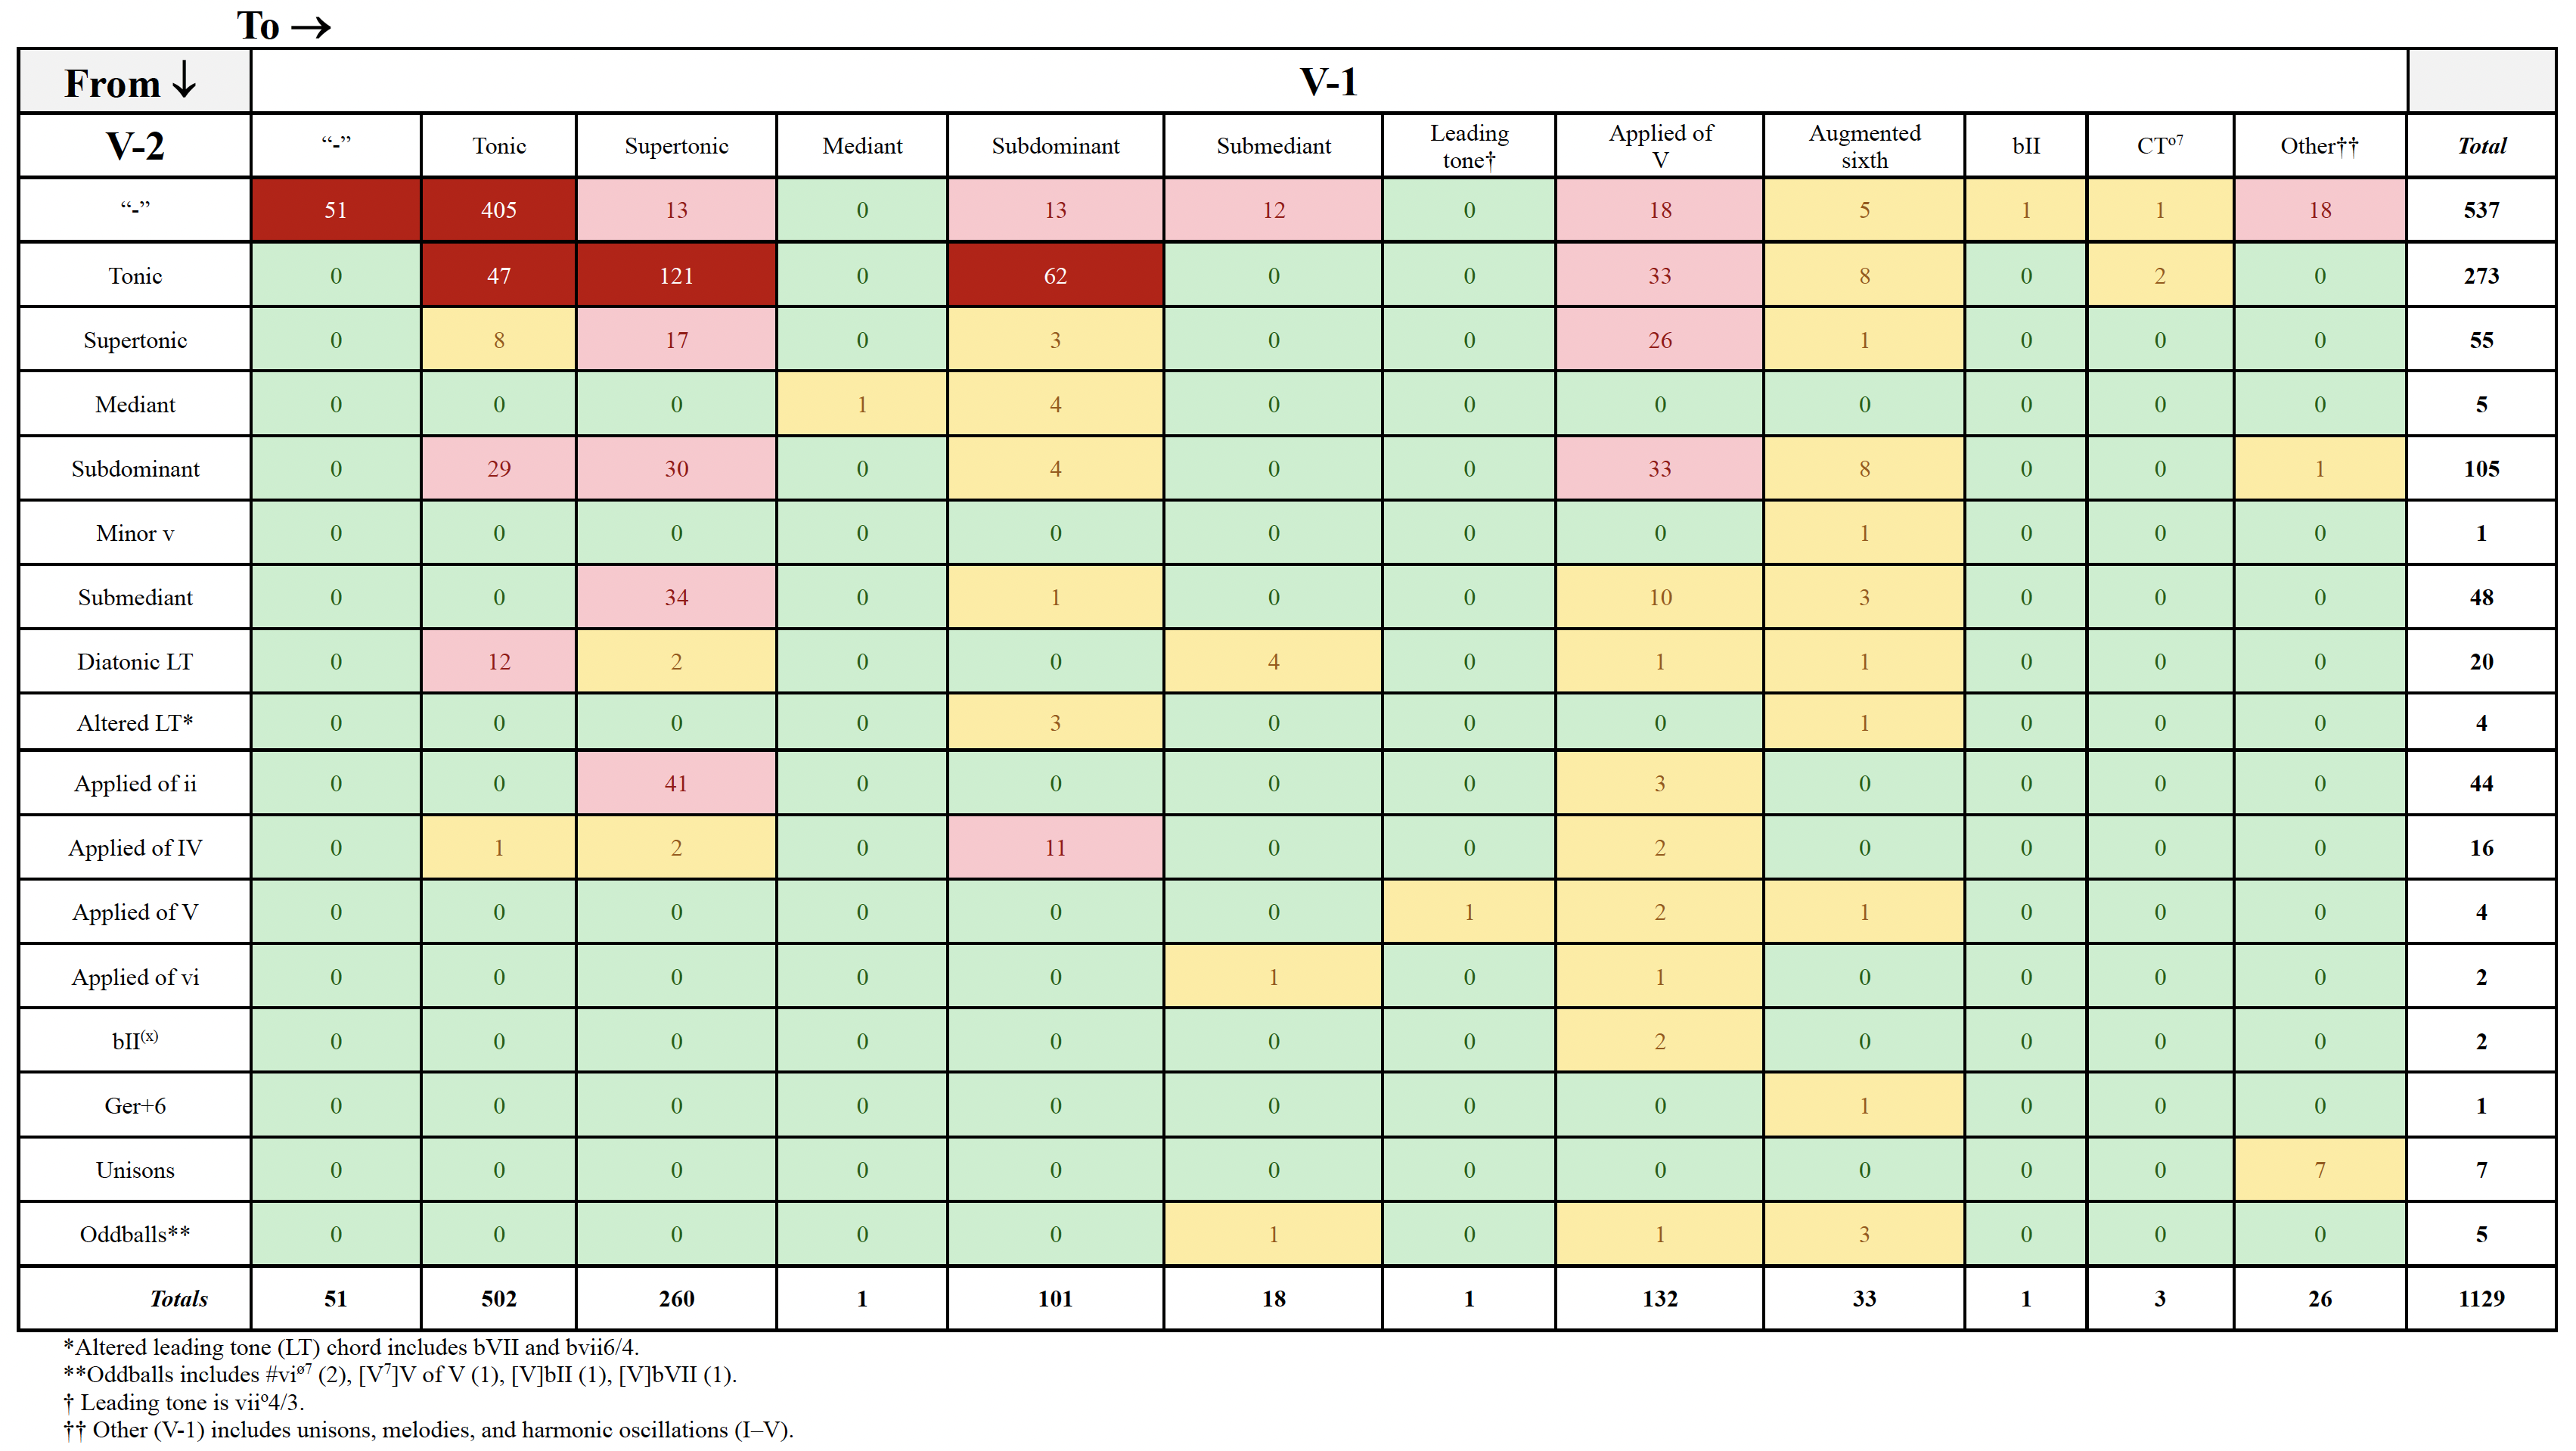
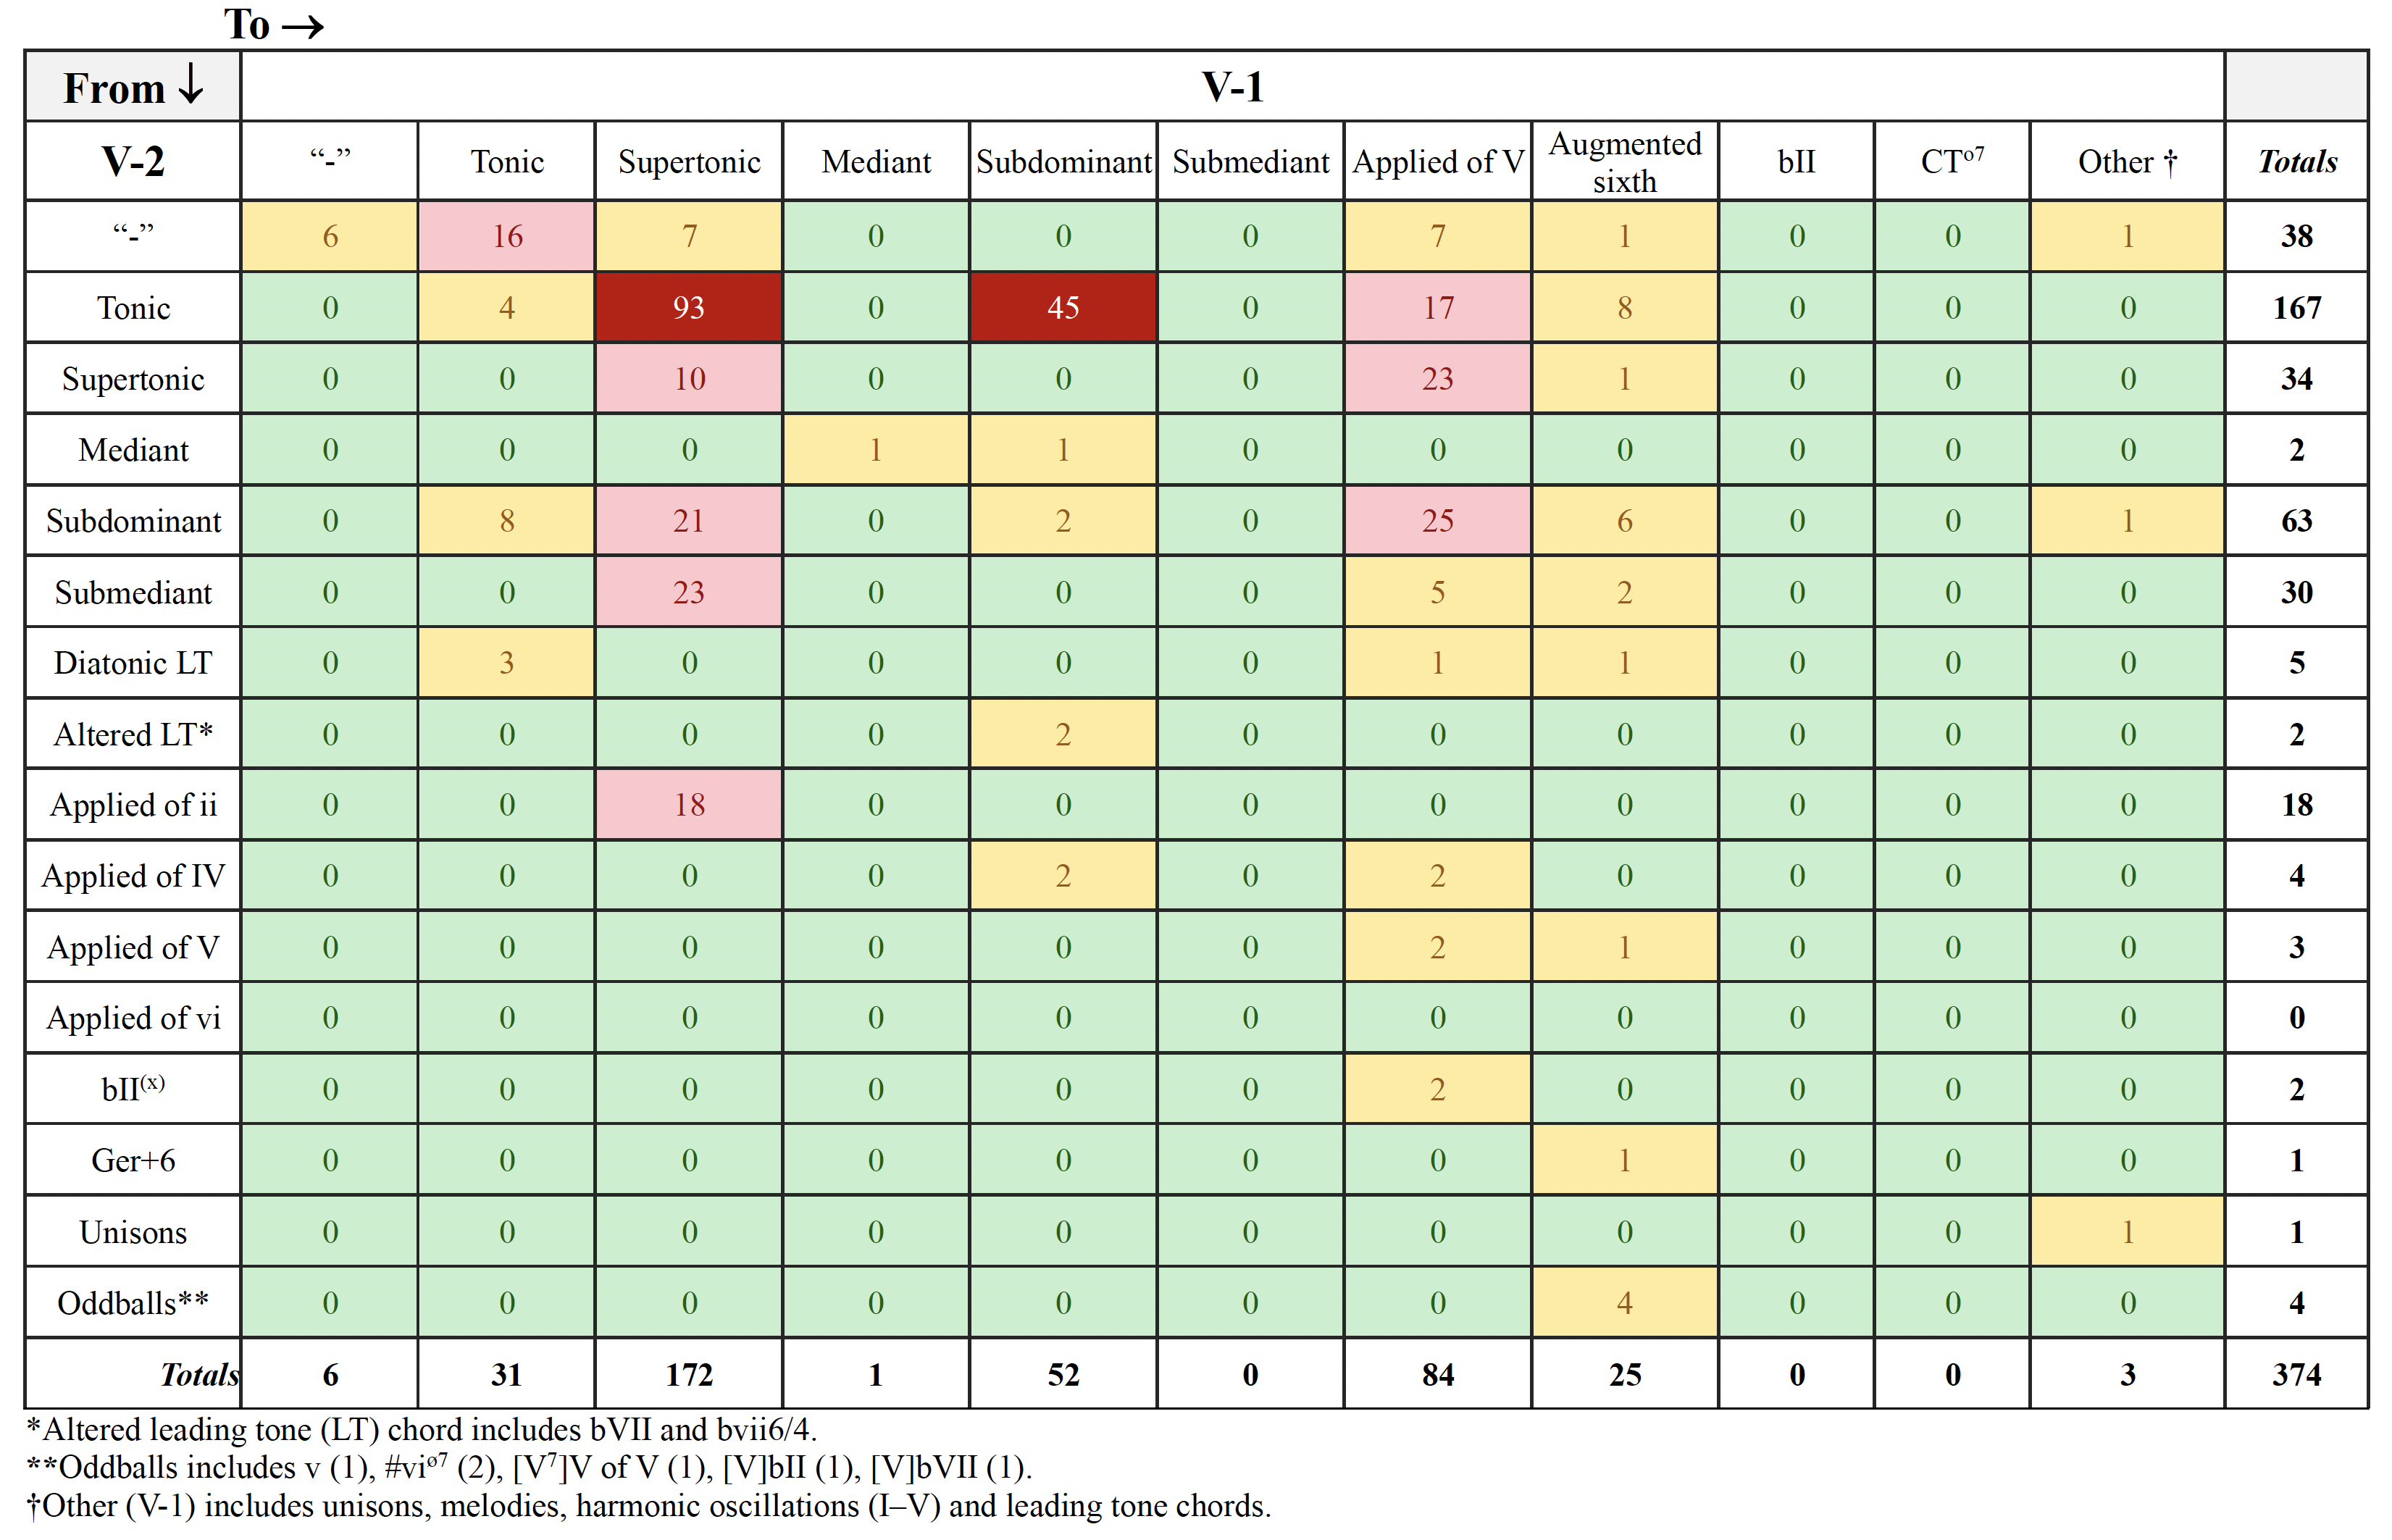
Example 10. (A) Heatmap illustrating the frequency of transitions from the chord occurring two chords before V (“V-2” on the y-axis) to one chord before V (“V-1” on the x-axis) in the dataset. (B) Heatmap illustrating the frequency of transitions at cadences from V-2 (y-axis) to V-1 (x-axis) in the dataset.