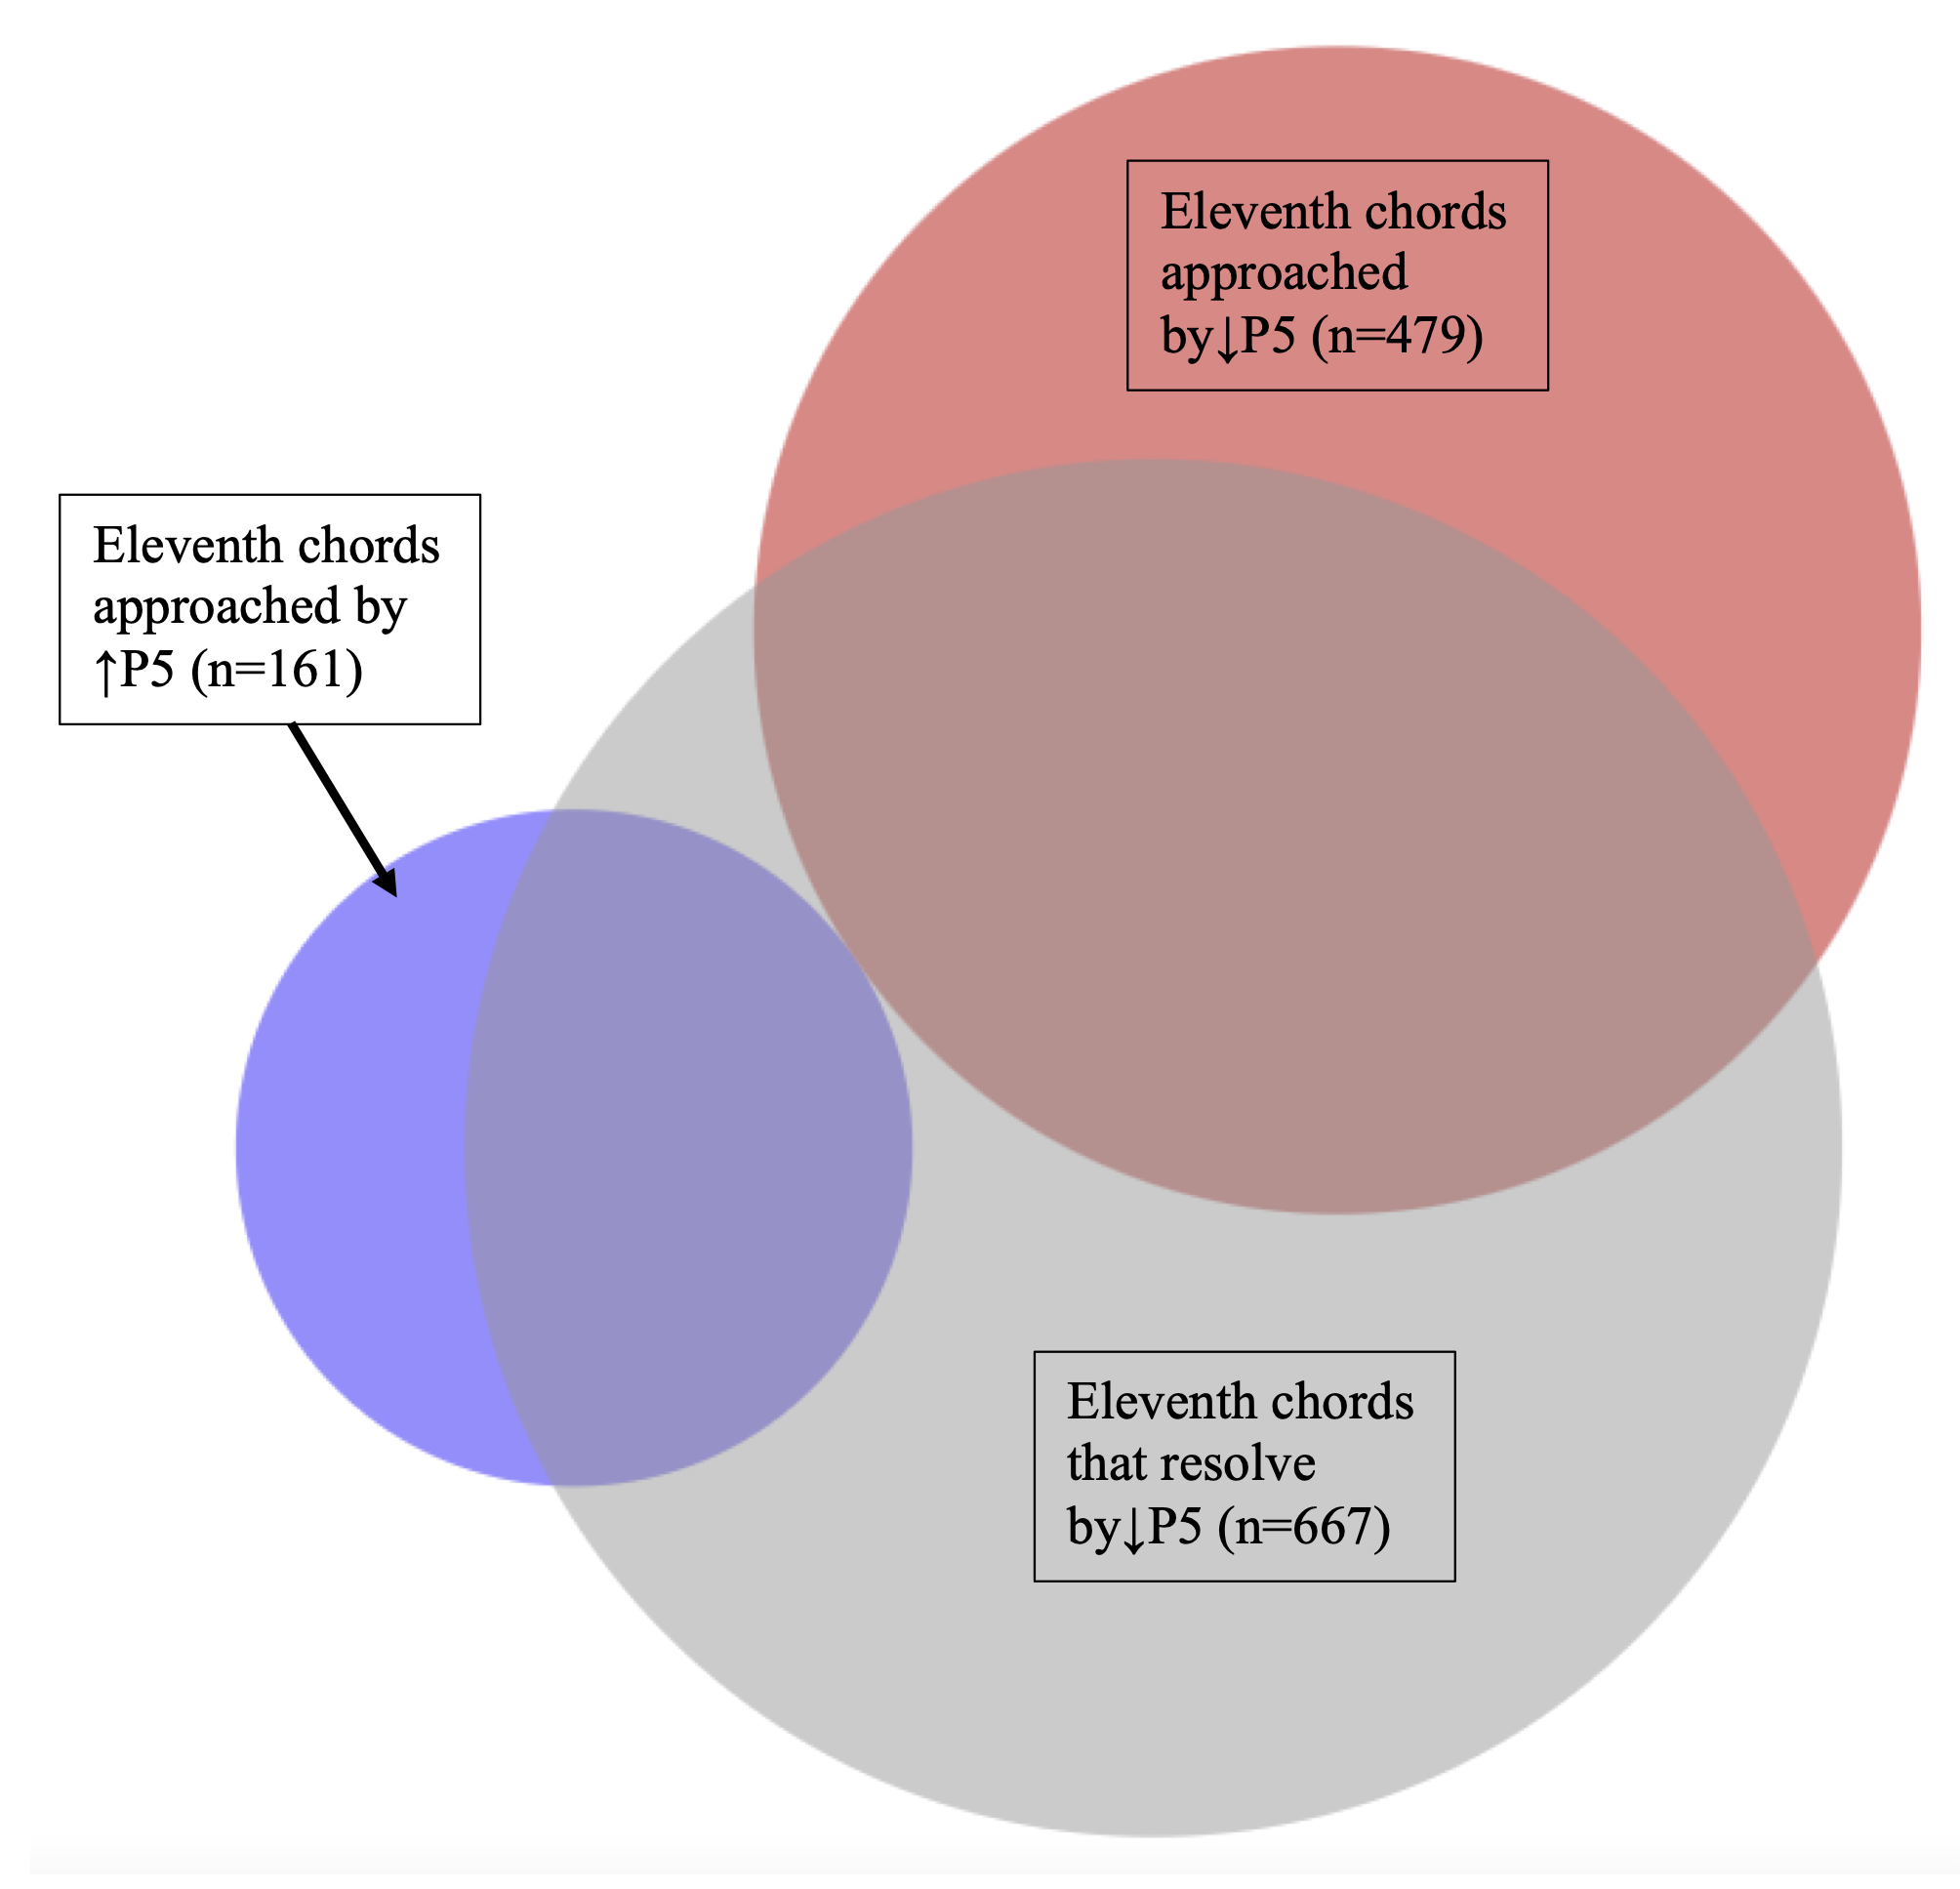
Example 14. Area-proportional Venn diagram for Model A. The gray circle represents eleventh chords followed by bass motion of a descending P5. The red circle represents eleventh chords approached by a descending P5 in the bass voice. The blue circle represents eleventh chords approached by an ascending P5 in the bass voice.